

"The answers are all over the place!"
"The answers are all over the place!"
What to do when there are no clear categories

I recently did a stint for a client who was looking to complement its off-line services with digital services. I’m not allowed to elaborate on the context, but that doesn’t really matter for today’s topic: what to do when your survey results are all over the place.
Our client had compiled a few ideas for digital services on their own and agreed to do focus groups and one-on-one interviews with (potential) customers to gather more ideas. Our goal with these interviews was not to find out whether people would like or use a specific service. Instead, I wanted to find out what people were trying to achieve in the context of my client’s business. Based on these observations, we generated more ideas for digital services to improve customers’ lives and achieve our client’s goals.
After pruning the ideas (some were too ambitious, some plain silly), we created a list of 18 abstract ideas for digital services. We agreed to test these ideas to understand whether the market would consider any of them valuable.
We poured our ideas in a Kano survey and collected about 150 responses. The result was… well, all over the place.

Or, rendered visually:
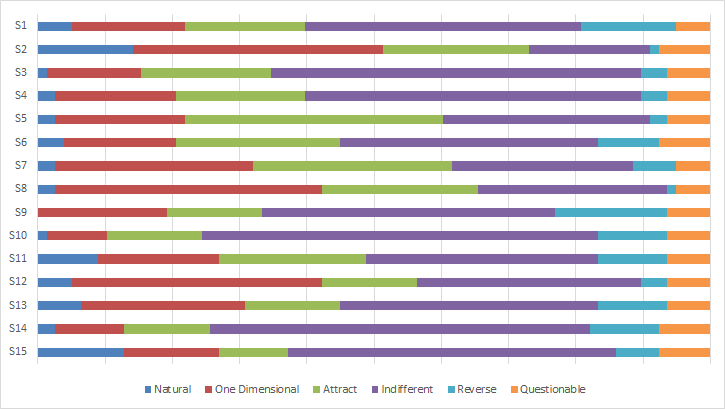
Confronted with such an outcome, you might be inclined to just follow the Kano model, pick the highest scoring category for each service and work from there.
But your gut tells you that this would be too reductive. For example, the nuance between S5 (with 24 Indifferent responses) and S10 (with 46 Indifferent responses) would be lost if you’d just categorize both as Indifferent and work from there.
Also have a look at S7. It has as many answers for One-Dimensional (meaning that the better the feature performs, the more customers will value it) as for Attract (meaning customers like its presence, but won’t dislike its absence). That’s conflicting; you can’t base a feature’s roadmap on such a result.
An unsurprising result
The results of our Kano survey didn’t surprise me (although one always hopes for clear-cut results). Three things were at play here:
The services we had thought out were quite innovative in their nature. No competitors of our client were offering the types of services we had surveyed the market about. People had a hard time imagining the value of these services, so their answers were more in the range of positive/negative than must-have, the-more-the-better, attractive, etcetera. This also explains the many Indifferent answers: as Noriaki Kano himself had proven, new product features are often met with indifference because people haven’t experienced their potential value yet;
We recruited surveyees through the client’s website, and that website attracts different types of customers. Answers that are all over the place indicate that the audience is segmented. The audience consisted of heavy users, first-time users and non-users;
The services we questioned the market about were abstract in nature. This, combined with the novelty factor, naturally leads to varying interpretations. People’s answers were based on what they individually imagined the concrete realisation of the service would be.
Measuring perceived value
The goal of our survey was to gauge the market’s perceived value of our service ideas and prioritize accordingly. We wanted to know which one of these services was worth investigating further because customers considered them valuable.
So we did not strive to create a digital services roadmap based on the quality of the value (i.e. the category), but only on the value itself (i.e. do people think it is valuable at all).
In 1993, an engineer called Mike Timko created a solution to this problem. He
wanted to calculate an average of some sort while also preserving some idea of the spread over Attractive, One-dimensional and Must-be features. This gave [him] the idea to reduce the data to two numbers: a positive number that is the relative value of meeting this customer requirement (…) and a negative number that is the relative cost of not meeting this customer requirement.1
Timko reduces the categories to a “cost of absence” (i.e. how much pain are we causing by not creating a service) and a “value of presence” (i.e. how satisfied will people be if we do create the service).
Calculating these numbers is dead easy:
 / (attract + one-dimensional + must-be + indifferent) and Worse = (one-dimensional + must-be) / (attract + one-dimensional + must-be + indifferent)")
Which brings us to this:

Visually, the difference in value between the services looks like this:
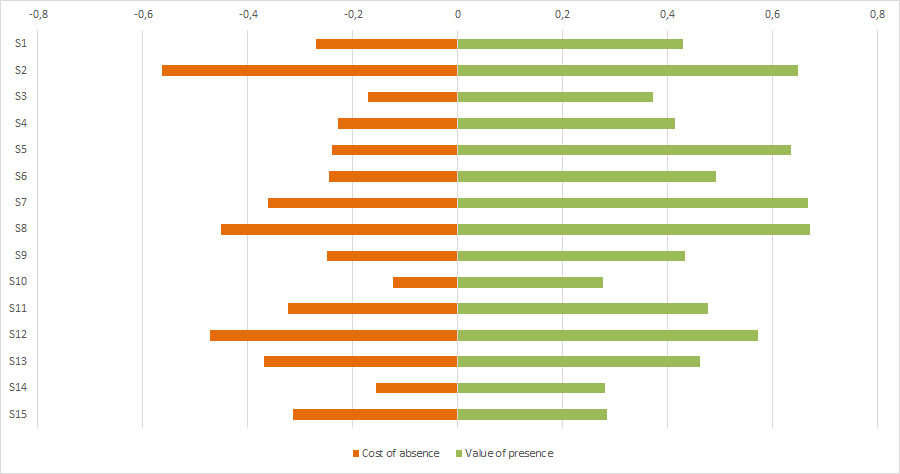
S2 clearly is a service that the respondents would appreciate the presence of. But what’s even more important, they would severely miss it if it weren’t there: the cost of the service not being there is the highest of all services.
Cost of absence is the leading parameter for prioritising services. In the words of one Kano researcher2:
to ensure customer satisfaction, it is vital to do away with customer dissatisfaction.
Or, as a colleague of mine once said: “to create a beautiful garden, pull out the weeds first”3
Prioritised by cost of absence, this is the result of our Kano survey:
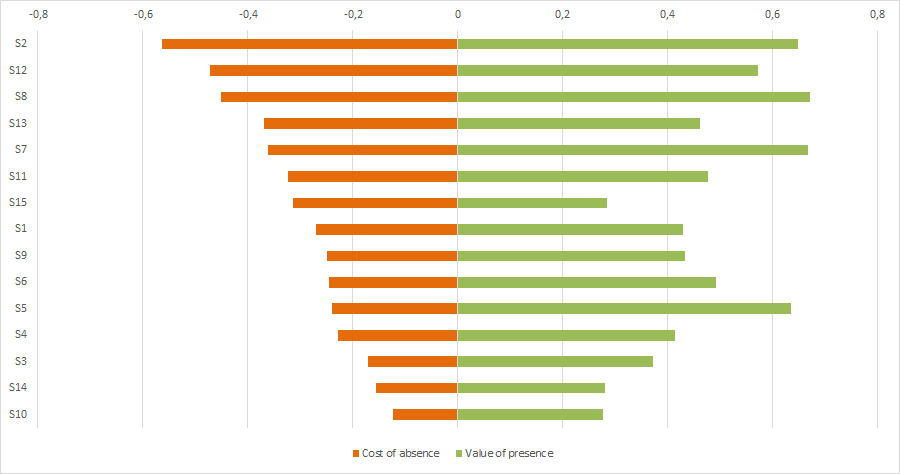
The above graph tells us exactly what services to work on first and in what order.
Using the Kano model for prioritising features
Kano categories (Must-be, One-Dimensional, …) serve two purposes: knowing what to work on first, and knowing how to work on them (which will be the topic of a later post). But if there are multiple features in one category (say you have five must-be features), or features are scattered all over the different categories, categories alone won’t help you decide with confidence.
Mike Timko’s formula of calculating cost of absence and value of presence is a great tool to help you decide what features to work on first, especially when you’re still in a phase where features are abstract ideas and/or innovative. Start working on the features whose absence would negatively impact customer satisfaction the most.
Berger, Charles, Robert Blauth, and David Boger. "Kano’s Methods For Understanding Customer-Defined Quality." Center for Quality of Management Journal (Fall 1993): 2-28.
Chen, Mu-Chen, Chia-Lin Hsu, and Chun-Han Huang. "Applying the Kano model to investigate the quality of transportation services at mega events." Journal of Retailing and Consumer Services 60 (2021): 102442
Hat tip to Frederik Marain.